CBA SALES OVERVIEW &
FULL RESEARCH REPORT
Washington Commercial Property Sales Market: Led by Multifamily, 2025 Marks the Beginning of the Recovery
Commercial Brokers Association
Q4 2024 Sales Analysis Report
CBA's Commercial Market Analysis (CMA) Sales Report analyzes yearly and quarterly economic and commercial real estate sales activity and trends at the market and submarket levels. Our end-of-year report provides a detailed look into Washington’s commercial property sales market, which has officially entered the early recovery phase, marked by strong growth and increasing transaction activity.
Key Q4 Highlights
- Market Recovery Begins - After a tough 2023 and a slow Q1 2024, the commercial property sales market rebounded with three consecutive quarters of growth, marking the start of post-COVID recovery.
- Multifamily Leads Sales - Multifamily has led the market, with sales volume shares of 43% (2024) and 40% (2023), up from the historical low-to-mid 20% range. This shift is due to declines in other asset classes, particularly office, and Washington’s housing shortage.
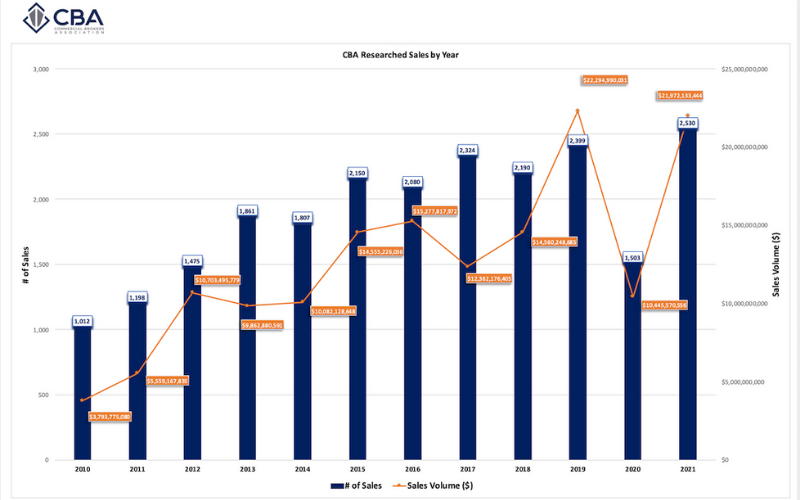
- Sales Volume Growth - Total sales volume surged 38% to $9.8B in 2024, though it remained below the $10B recorded in 2020. Transaction counts rose 5%.
- Q4 Breaks Records - Q4 2024 had the highest sales velocity and volume in nine quarters. Five multifamily transactions totaling $786M made up 25% of the quarter’s commercial volume.
- Retail Leads in Transactions - Retail led in transaction count, with 569 deals (30% of the market), consistent with its 27%-33% share over the past four years.
- Market Still Below Peak - Despite recovery, market volumes remain well below the 2021 peak, with dollar volume down 48% and transactions down 34%.
- Interest Rates and 2025 Outlook - In 2025, interest rates will shape the recovery. While market activity should exceed 2024 levels, rates are unlikely to drop significantly, signaling a "new normal" in the coming years.
Asset Class Annual Dollar Volume Rankings (2024 vs 2023)
- Multifamily: $4.18B (+47.6%)
- Ind/Flex: $1.78B (+55.5%)
- Retail: $1.65B (+46.1%)
- Office: $1.38B (+41.5%)
- Land: $779.3M (-20.5%)
Asset Class Quarterly Trends (Q4 2024 vs. Q4 2023)
- Office: +3% sales count, +62% volume
- Retail: +20% sales count, +63% volume
- Industrial/Flex: +12% sales count, +163% volume
- Land: -17% sales count, -49% volume
- Multifamily: +56% sales count, +99% volume
County Performance (2024 vs. 2023)
- King: +11% sales count, +73% volume
- Snohomish: -4% sales count, +25% volume
- Pierce: +10% sales count, +10% volume
- Spokane: -6% sales count, -24% volume
- Kitsap: +29% sales count, +30% volume
- Thurston: -11% sales count, -19% volume
- Whatcom: +8% sales count, -34% volume
- Skagit: +8% sales count, +32% volume
County Quarterly Performance (Q4 2024 vs. Q4 2023)
- King: +21% sales count, +86% volume
- Snohomish: +11% sales count, +90% volume
- Pierce: +13% sales count, +92% volume
- Spokane: +7% sales count, +37% volume
- Thurston: -47% sales count, -56% volume
- Whatcom: +3% sales count, -17% volume
- Skagit: +37% sales count, +86% volume
DOWNLOADABLE REPORTS
CBA researches office, retail, industrial, multifamily (5+ units), and land sales, $250,000 or more, in King, Kitsap, Pierce, Skagit, Snohomish, Spokane, Thurston, and Whatcom counties. The raw data in our reports are pulled directly from the CBAcma database.
For questions about the report, please contact Binh Truong, VP of Market Data and Business Development, at binh@commercialmls.com or 425-952-2727.
page44.png)
page%2055.PNG)
ARCHIVED CBA SALES REPORTS
Reference previously archived CBA Sales Reports here: